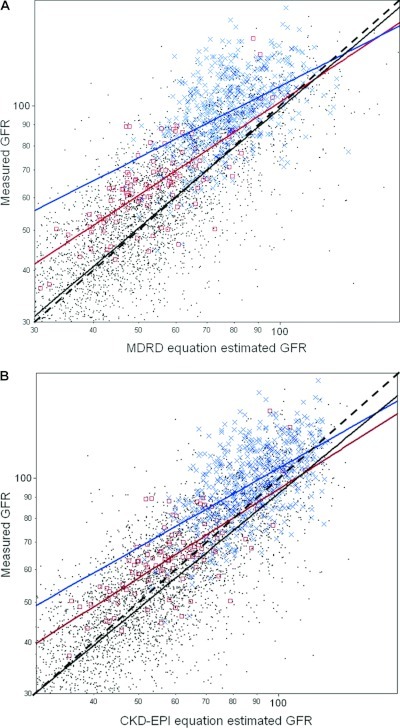
Figure 1.
GFR measured by iothalamate clearance (mGFR) is plotted against GFR estimated by the Chronic Kidney Disease Epidemiology Collaboration (CKD-EPI) equation (Panel A) and the Modification of Diet in Renal Disease (MDRD) equation (Panel B) on a log-log scale for 5238 patients. The black dashed line represents the line of identity. With either equation, the blue regression line for potential kidney donors (blue ×) and the red regression line for postnephrectomy kidney donors (red □) show systematic deviation (underestimation) from the line of identity. With the CKD-EPI equation, the black solid regression line for native CKD and transplant recipients (black dots) also shows systemic deviation (overestimation) from the line of identity.

