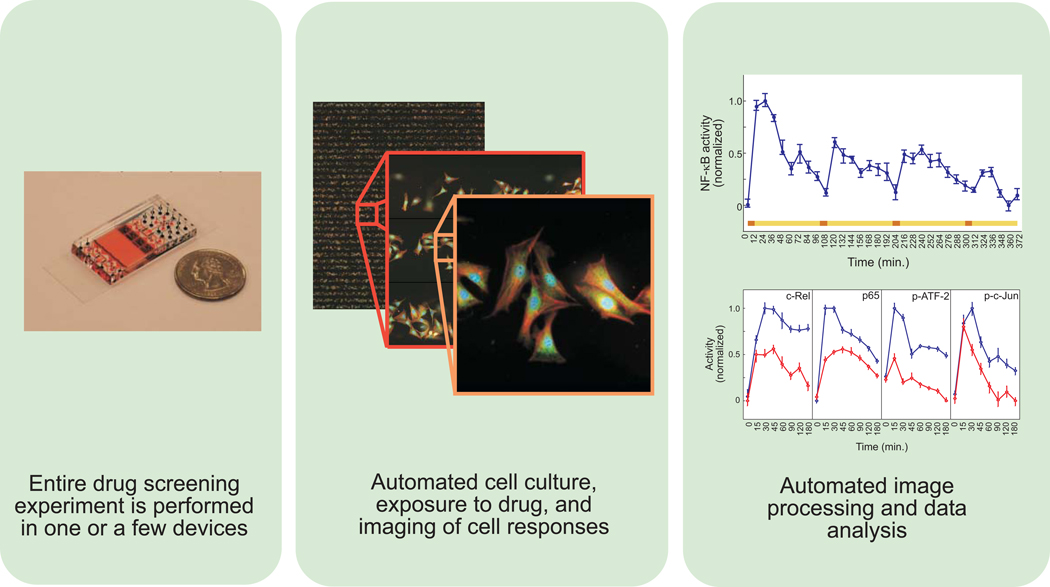
Figure 2. Features of a microfluidic-based high content screening system.
Left panel, depiction of device next to a U.S. quarter of a dollar coin. Highly miniaturized microfluidic devices may enable large scale drug screening experiments to be performed in a single device. Middle panel, high content images of cells stimulated and stained within a microfluidic device. Cell culture, exposure to stimuli, and staining and imaging of cell responses can all be performed in microfluidic devices. Right panel, images of individual cells are processed and analyzed to determine drug effects. Top graph shows NF-κB responses to periodic stimulus. The colored bar depicts the input time course consisting of sequential pulses of tumor necrosis factor (TNF) in red with intervening washouts in yellow. The bottom graph shows TNF responses of the indicated transcription factors in the presence (red) or absence (blue) of the drug SC-514. Inhibitory effects are seen on the NF-κB pathway (c-Rel and p65) as well as JNK signaling (ATF-2 and c-Jun). Images and graphs were originally published in Molecular Cellular Proteomics 19, and are used with permission.

