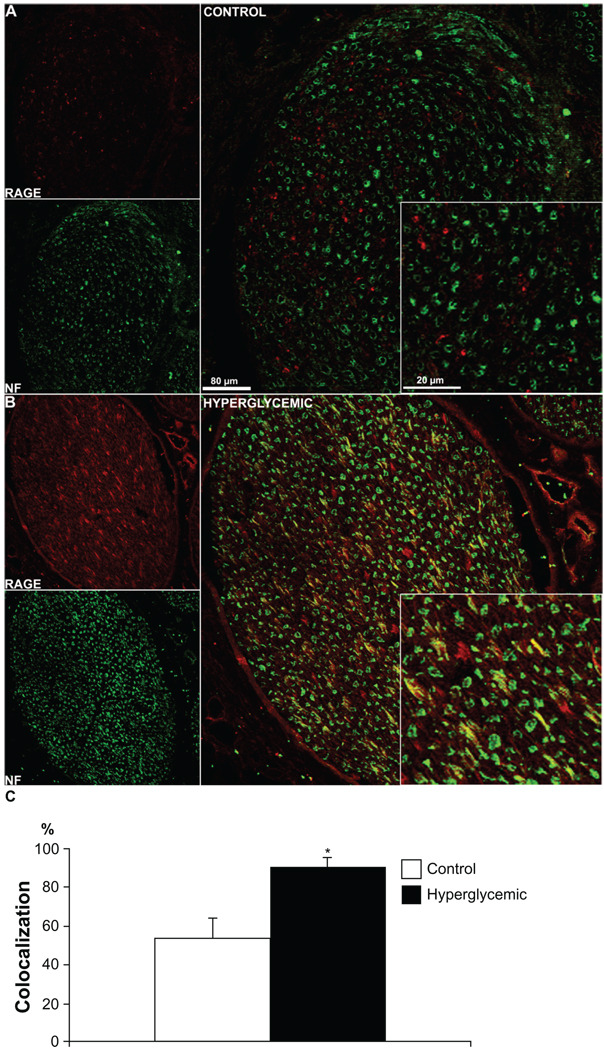
Figure 4.
Neuronal RAGE staining. Confocal images of double immunostaining of RAGE (red) with the neuronal marker, Neurofilament (NF, green). Colocalization of RAGE and NF is very low in the control tissue (A), but it is observed in the diabetic tissue (B), suggesting that RAGE presence might be largely limited to Schwann cells in sciatic nerves of healthy animals but it is localized to nerve fibers in the hyperglycemic animals. As expected under hyperglycemic conditions, an increase in RAGE staining is not only observed in the nerve but also in surrounding blood vessels (B). The quantitative analysis of the colocalization pattern revealed significant difference in number of RAGE positive fibers co-stained for NF between control and hyperglycemic animals (C). *P < 0.03.

