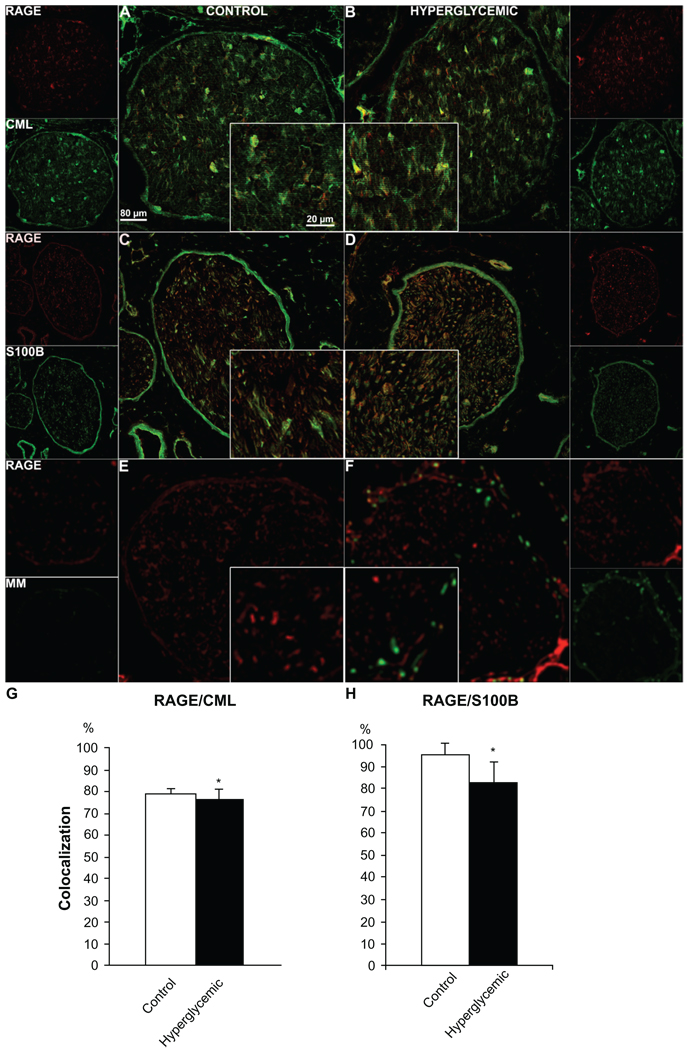
Figure 6.
Colocalization of RAGE and its ligands S100B and CML and RAGE co-expression with macrophage marker (MM). Sciatic nerve sections from control and diabetic animals were subjected to RAGE (red) co-immunostaining with CML (Carboxymethyl Lysine, A, B, green), S100B (ligand/Schwann cell marker, C, D, green), MM (macrophage marker, E, F, green). The quantitative analysis of the colocalization pattern revealed that there was a significant difference in number of RAGE/S100B positive fibers between control and hyperglycemic animals (G, H). *P < 0.001.

