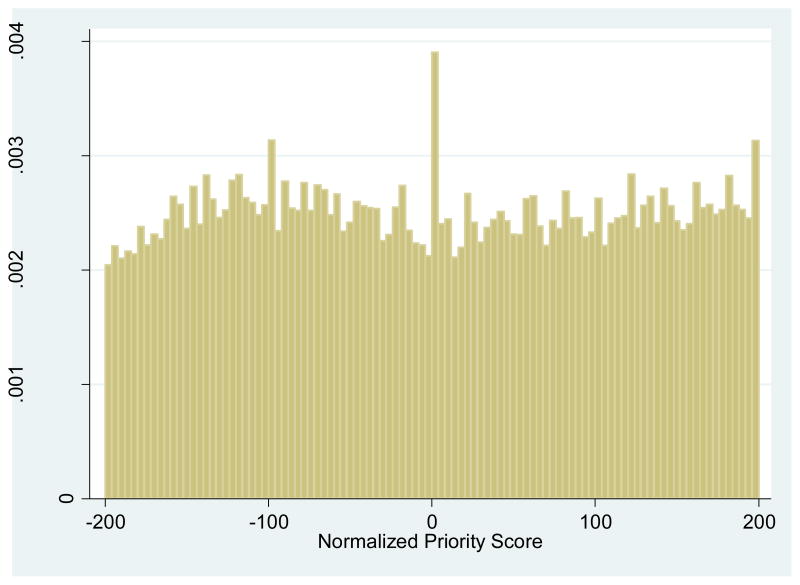
Figure 4.
Histogram of Normalized Priority Scores
Notes: The figure shows a histogram of normalized priority scores. The spike at zero is due to the fact that we define the cutoff empirically as the score of the application that would be funded if funding decisions were made in strict order according to priority score.

