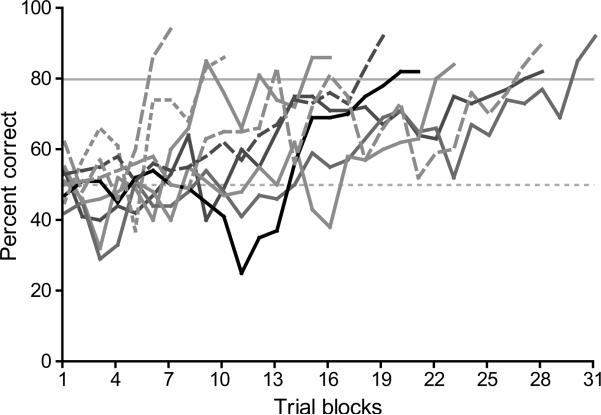
Figure 2.
Performance of all birds on baseline training. Cumulative performance of birds trained on long calls (solid lines) and songs (dashed lines) over 100-trial blocks to criterion. Each line shows the performance for an individual bird. All birds performed similarly during baseline training, regardless of the stimulus type (N = 9). The black curve is the performance of an individual bird representative of the median (Mdn ± IQR = 21 ± 15, N = 9) number of trial blocks to criterion for cohorts 1 and 2 combined. The dashed gray line represents 50% correct responses or chance performance; the solid gray line represents criterion (80%) correct performance.

