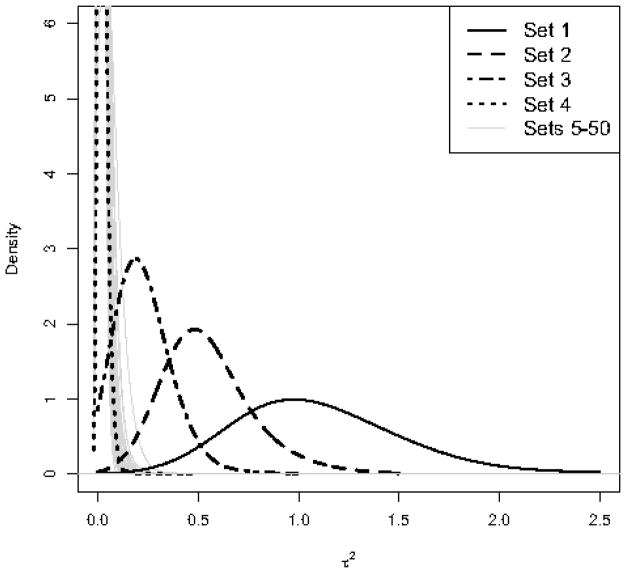
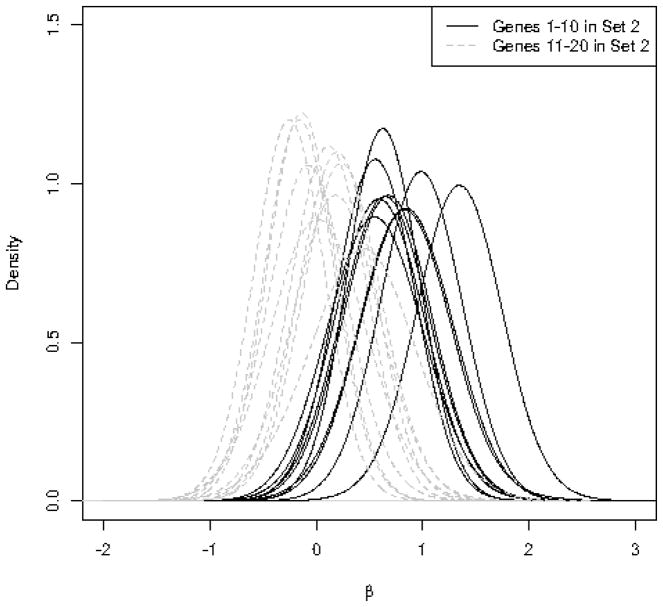
Figure 1.
Left panel: Posterior distribution of the hyperparameter for 50 simulated gene sets. Sets 1–4 have 20, 10, 5, and 2 significant genes respectively. Sets 5–50 contain no significant genes. Right panel: Posterior distribution of βsg for individual genes in Set 2, where the first 10 genes are significantly upregulated (the constant 1 is added to the expression values for the treatment group). The remaining 10 genes in this set are non-significant (βsg = 0).


