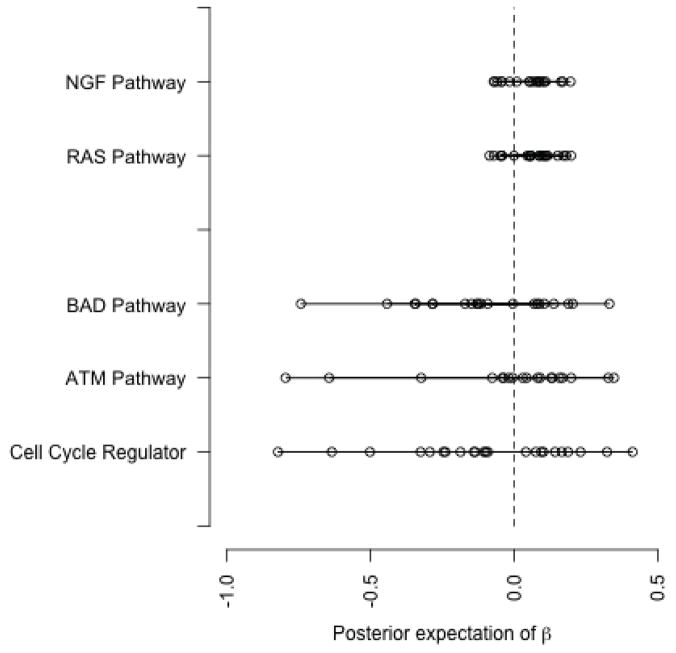
Figure 3.
Comparing the pathways which are not common between the results based on BGSA and GSA. “Cell Cycle Regulator”, “ATM pathway”, and “BAD pathway” are selected by BGSA only. RAS and NGF, on the other hand, are identified as significant by the GSA method. Each point shows the posterior expectation of βsg for an individual gene in the pathway.

