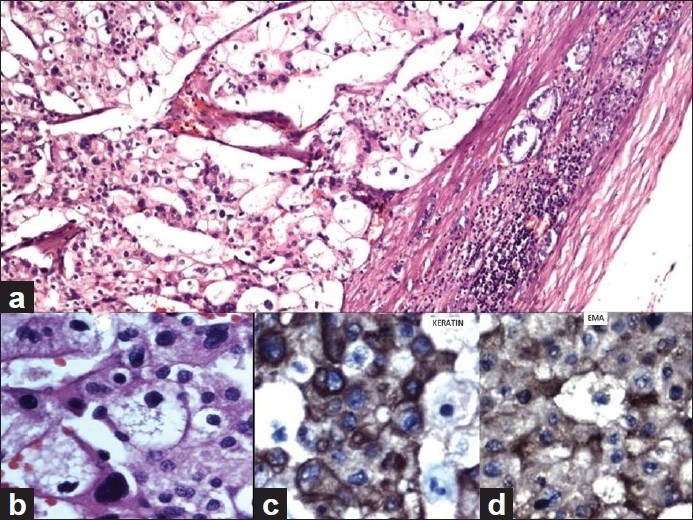
Figure 3.

Renal cell carcinoma (H and E). (a) Large tumor cells with mostly clear cytoplasm are seen. Renal capsule and few renal tubules are seen at the periphery (H and E, ×10). (b) Large pleomorphic tumor cells both with clear cytoplasm and eosinophilic granular cytoplasm (H and E, ×40). (c) Pleomorphic tumor cells showing positivity for Keratin (IHC, ×40) and (d) Tumor cells showing positivity for EMA (IHC, ×40).
