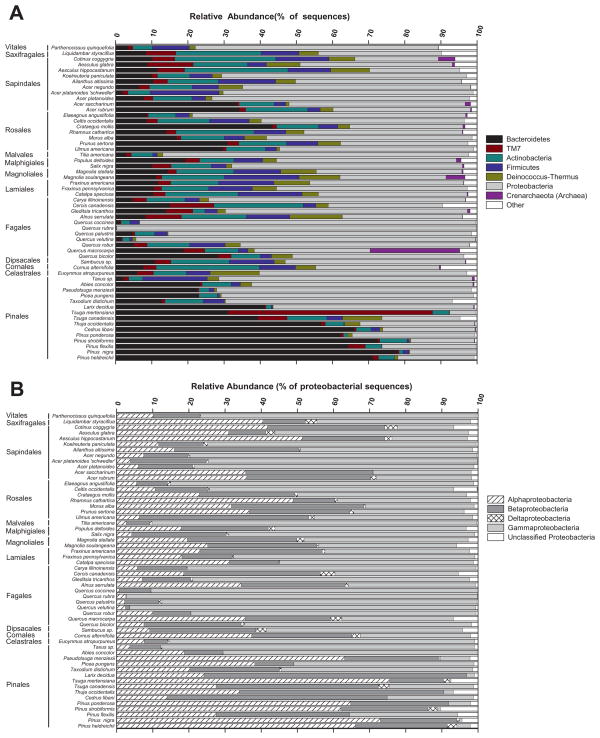
Fig. 1.
Relative abundances of bacterial phyla and sub-phyla in each of the phyllosphere communities from the ‘inter-species’ study: (A) bacterial phyla (B) only proteobacterial sub-phyla. Note that B only shows the percentages of the various proteobacterial sub-phyla relative to the total abundance of Proteobacteria on each tree. We also note that in this figure we are only focusing on the interspecies variation as each symbol represents data from a single individual tree (see Fig. 3 and the associated section of the Results for a description of how intraspecies variation in bacterial community composition compares to interspecies variation across this study site).

