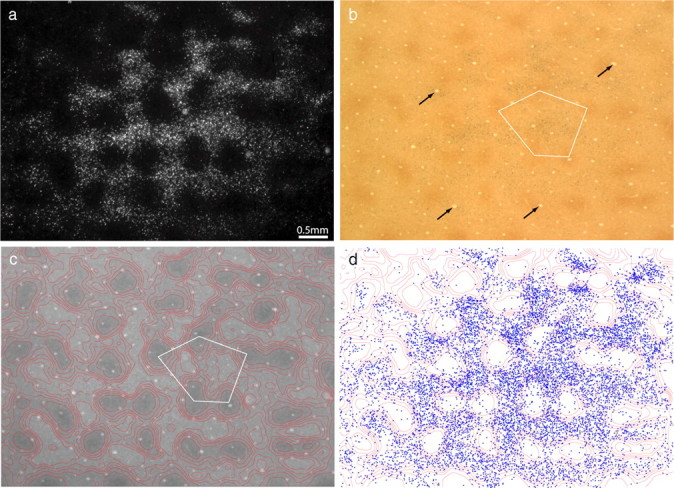
Figure 2.

Thick stripes receive input from interpatches in layer 2/3. a, Retrogradely labeled cells, appearing bright in dark-field illumination, located in upper layer 3. The field corresponds to the rectangle in Figure 1b, but is 300 μm more superficial. b, The same section viewed in bright field, revealing the pattern of CO staining. The white pentagon denotes an interpatch zone in which cells were plotted in serial vertical sections to determine the relative laminar distribution of labeled cells in the field. Black arrows denote blood vessels used to align CO contours onto deeper sections. c, Contours partitioning the CO activity into six zones of equal area. CO patches were defined as the darkest two zones. d, Plot of 9980 labeled cells in a, showing that they fill the CO interpatches and avoid the CO patches.
