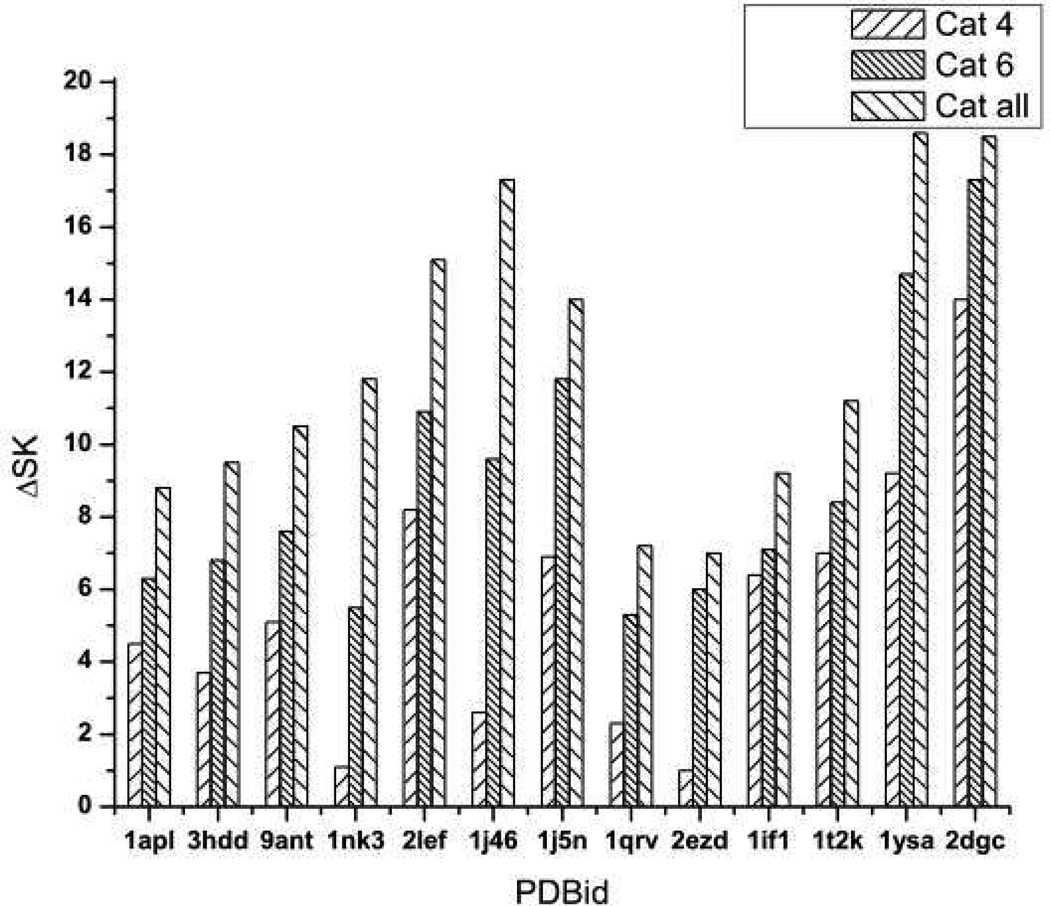
Figure 2.
A histogrammatic analysis of nonlinear PB results for the protein-DNA complexes listed on the abscissa. The vertical bars give values of ΔSK as calculated by PB computation. The left-most bar in each set of three is the result of switching off the charge on cationic residues within 4 Ǻ of a phosphate; the middle bar, of switching off cationic residues within 6 Ǻ; and the right-most bar, of switching off all cationic residues.

