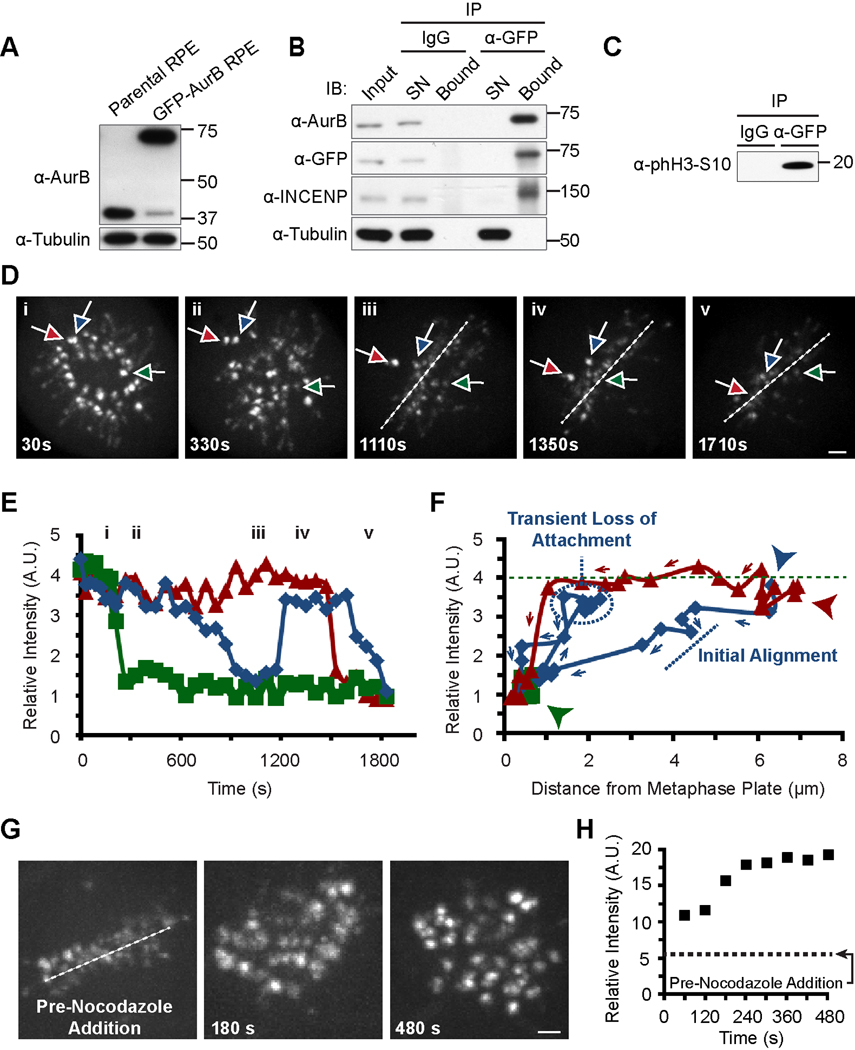
Figure 2. Aurora B levels at centromeres drop upon chromosome alignment but rapidly increase if proper attachments are lost.
(A) Replacement of the vast majority of endogenous Aurora B in RPE cells with a stably expressed GFP-tagged version.
(B) Co-immunoprecipitation of GFP-Aurora B and endogenous INCENP. IB indicates immunoblot. SN indicates supernatant.
(C) GFP-Aurora B immunoprecipitation contains active Aurora B kinase that potently phosphorylates recombinant histone H3 on serine 10. Molecular weights (kDa) are indicated in panels A, B and C.
(D) Individual images from live cell imaging following monastrol washout in GFP-Aurora B-expressing RPE cells (see Movie S1). Three centromeres exhibiting different alignment kinetics are tracked with colored arrows. Time represents duration following withdrawal of monastrol. Dashed lines show the position of the metaphase plate that was first discernable at ~500 s following monastrol washout.
(E) Quantification of Aurora B levels over time at same three centromeres tracked in panel D using the same color scheme. Roman numerals indicate time points of still images shown in panel D.
(F) Plots of fluorescence intensity for each centromere versus distance from metaphase plate for each centromere with coloring as in panels D and E. The first timepoint shown in this panel is 510 s (indicated by the three arrowheads with colors corresponding to each chromosome), the first time point at which the metaphase plate is discernable. Note that the quickly aligning chromosome (green) has already reached the metaphase plate by 510 s and remains aligned throughout the remainder of data acquisition. The green dashed line indicates the initial fluorescence intensity of GFP-Aurora B on the quickly aligning chromosome. Arrows indicate the direction of the time dimension with data points representing each time increment measured (see panel E).
(G) Individual timepoints of a metaphase cell prior to and following (with the indicated timepoints) nocodazole addition (see Movie S3). Scale bar = 2 µm in panels D and G.
(H) Quantification of Aurora B levels at all centromeres from panel G, in aggregate. Aurora B levels prior to nocodazole addition are indicated with a dashed line.

