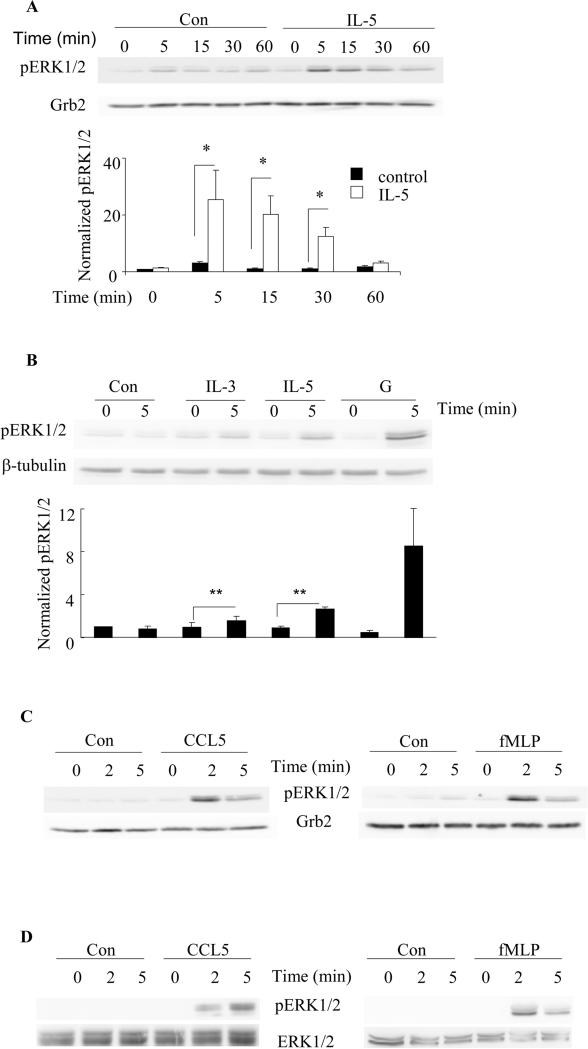
Figure 4. Kinetics of ERK1/2 phosphorylation in the dif-HC15 cells in response to IL-5 family cytokines and chemotactic factors fMLP and CCL5.
A. The dif-HC15 were stimulated with 100 pM IL-5 or control vehicle for the indicated times. Cell lysates were subject to SDS-PAGE and immunoblotting for pERK1/2 and Grb2. The upper panel shows representative immunoblots of pERK1/2 and Grb2 of six independent experiments. ERK1/2 phosphorylation levels were normalized to that of Grb2, and IL-5-treated at time 0 was set to be 1. Data are summarized as the mean ± (SEM) of six experiments in the lower panel. *p<0.05, N=6. A two-way ANOVA was used for the statistical analysis. B. The dif-HC15 cells were stimulated with control (Con), 1nM IL-3, IL-5 or GM-CSF (G) for 0 or 5 min. The upper panel shows representative immunoblots of pERK1/2 and β-tubulin of three independent experiments. The lower panel is the summary of the mean ± (SEM). The control-treated cells at time 0 was set to be 1. **p<0.05 N=3. The dif-HC15 cells (C) and human blood eosinophils (D) were stimulated with 10 nM CCL5 or 100 nM fMLP for 0, 2 or 5 min. Representative immunoblots of pERK1/2 and the corresponding loading controls of three independent experiments are shown.

