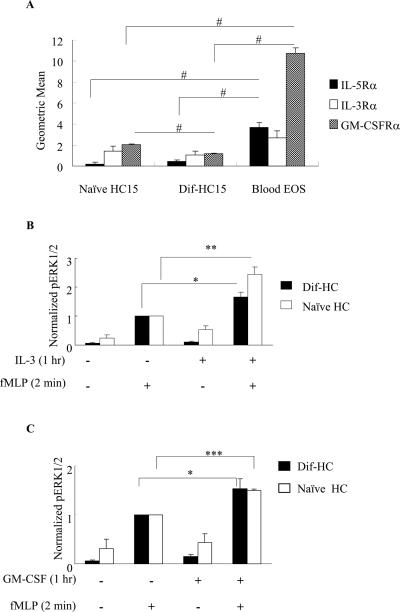
Figure 5. Surface expression profile of IL-5 family receptors and priming in HC15 cells.
A. Naïve HC15, dif-HC15 and human blood eosinophils (Blood EOS) were examined for surface expression of IL-5Rα, IL-3Rα and GM-CSFRα using flow cytometry as described under Materials and Methods. Geometric means of the α subunits were normalized by subtracting the geometric means of the corresponding IgG control and are presented as the mean ± (SEM); similar results were obtained when the data were normalized to a positive control (primary eosinophils) The data are summarized from four independent experiments for each receptor. #p<0.006, N=4. HC15 cells were primed with 1 nM of IL-3 (B) or GM-CSF (C) for 1 hr, and stimulated with 100 nM fMLP for 2 min. Protein levels of pERK1/2 and actin were detected by immunoblotting. Band intensities of pERK1/2 were normalized to that of actin. Cells treated with fMLP alone were set to be 1 in both panels. The data are presented as the mean ± (SEM). *p<0.02 **p<0.003 N=6, ***p<0.004 N=3.

