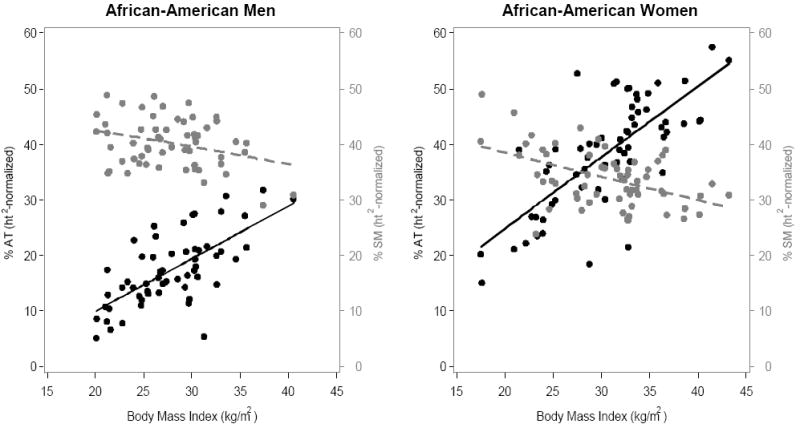
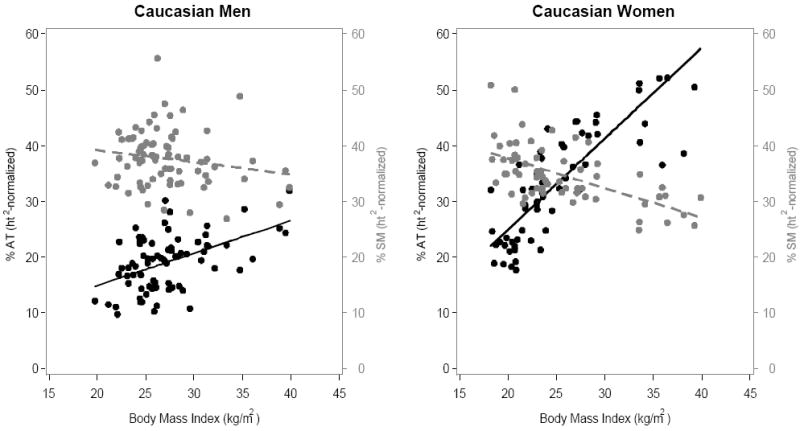
Figure 2.


(A) African-Americans; (B) Caucasians. Association of BMI with %AT and %SM , expressed as 100 × 0.92 g/cm3 × the ratio of total height2-normalized AT volume to body weight and 100 × 1.04 g/cm3 × the ratio of total height2-normalized SM volume to body weight in men (left) and women (right). Black symbols and whole lines denote %AT, and grey symbols and dashed lines denote %SM.
[%AT men: African American, y = -9.0 + 0.95x (R2=0.46, p<0.0001); Caucasian, y = 3.1 + 0.59x, (R2=0.24, p<0.0001). %AT women: African American, -0.73 + 1.28x (R2=0.55, p<0.0001); Caucasian, y = -7.6 + 1.63x (R2=0.72, p<0.0001)]
[%SM men: African American, y = 48.5 - 0.30x (R2=0.098, p = 0.018); Caucasian, y =43.5 - 0.22x (R2=0.031, p = 0.13). %SM women: African American, y = 46.9 - 0.43x (R2=0.23, p<0.0001); Caucasian, y = 48.3 - 0.53x (R2=0.35, p<.0001)]
