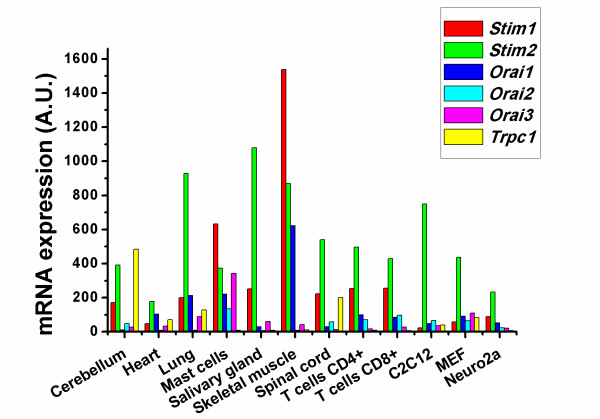
Figure 1.
Tissue distribution of Stim1, Stim2, Orai1-3 and Trpc1 in mouse. Data were extracted from the BioGPS database (http://biogps.gnf.org/) and represent the mRNA expression patterns in selected mouse tissues [67,68]. Stim1 is strongly expressed in skeletal muscle and mast cells, while Stim2 exhibits a relatively higher expression level in all tissues tested with pronounced expression in salivary-gland tissue. Orai1 expression is stronger in skeletal muscle, while there is low expression of all Orai in other tissues presented here. Trpc1 expression is relatively low in both heart and skeletal-muscle tissue, but higher in tissue of the central nervous system, such as in the cerebellum. These patterns do not necessarily reflect the expression at the protein level or the situation in humans, but provide a good view of the patterns observed in mouse models.

