
Fig. 2.
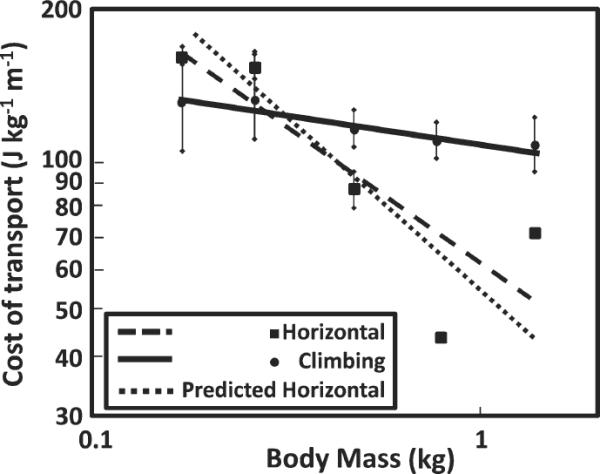
Graph of the cost of transport compared to body mass during horizontal locomotion and during climbing. The regression equation best describing COThoriz is COTHoriz = 51.5Mb −0.750 (r = 0.843; P = 0.073); the regression equation best describing the cost of climbing is COTclimb = 107.4Mb −0.119 (r = 0.858; P = 0.063) (Hanna et al., 2008). Note that neither slope is significant, probably due to the small sample size. The predicted COThoriz line of best fit was added in for comparison purposes. The predicted COThoriz was calculated for each individual using the equation: VO2/Mb = 0.300Mb −0.303 + 0.533Mb −0.316 V, from Taylor et al. (1982). Speeds and body mass were those observed in this study. Note that the actual COThoriz line of best fit is very similar to the predicted COThoriz.