
Fig. 3.
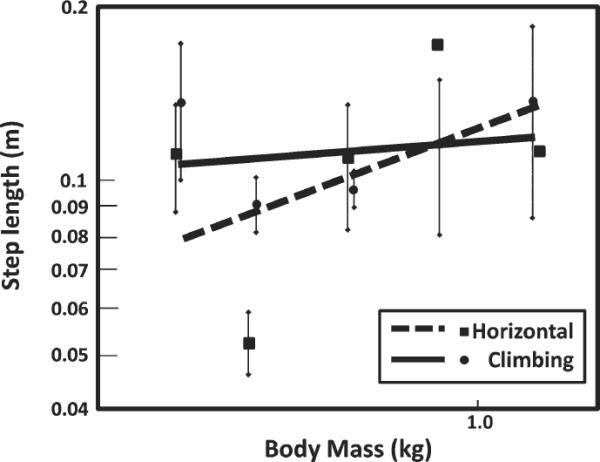
Graph of step length versus body mass during horizontal locomotion and climbing. Each point represents a species mean, and the lines represent ± 1 standard deviation. The data are plotted on log-log axes because Kram and Taylor (1990) found a linear relationship between these two variables when logged. The equation for horizontal locomotion is: log LcHoriz = −0.907 + 0.24 logMb where LcHoriz is step length and Mb is body mass. Although the slope of the line for horizontal locomotion is 0.245, close to the value of 0.30 found by Kram and Taylor (1990), the slope is not significantly different from zero (P 5 0.403). The equation for climbing is: log LcClimb = −0.937 + 0.047 logMb where Lcclimb is step length and Mb is body mass.