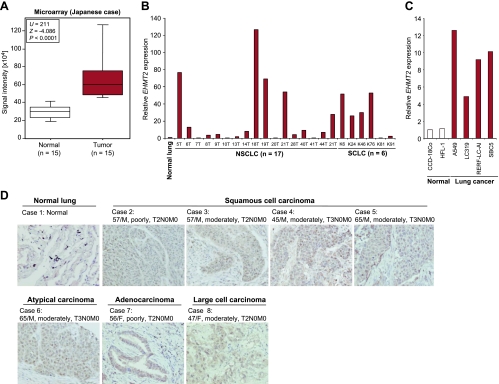
Figure 2.
Elevated EHMT2 expression in lung cancer. (A) Comparison of EHMT2 expression between normal lung and small cell lung cancer (SCLC) tissues. Signal intensity of each sample was analyzed by cDNA microarray, and the result is shown by box-whisker plot (median, 50% boxed). Mann-Whitney U test was used for the statistical analysis. (B) Expression of EHMT2 in normal lung, 17 non-small cell lung cancer (NSCLC) and 6 SCLC tissues. Expression levels were analyzed by quantitative real-time PCR. Data were normalized by normal lung expressions. (C) mRNA expression levels of EHMT2 in two normal human cell lines and four lung cancer cell lines examined by quantitative real-time PCR. Expression levels were normalized by GAPDH and SDH expressions, and values are relative to CCD-18Co (CCD-18Co = 1). (D) Immunohistochemical staining of EHMT2 in lung tissues. Clinical information for each section is represented above histologic pictures. Original magnification, x200.

