Figure 5.
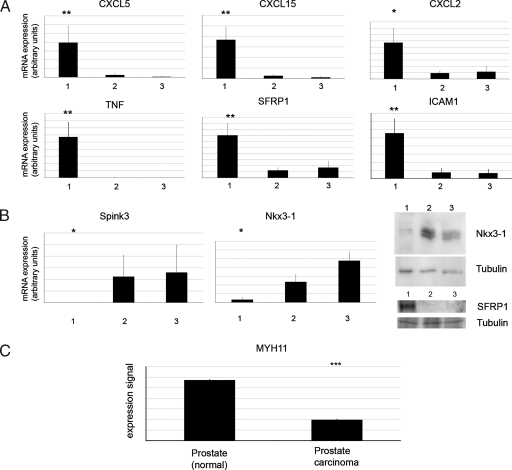
Confirmation of gene expression changes in transgenic prostates. (A, B) Quantitative RT-PCR experiments on samples from PE- PTEN+/-IKK2ca/ca prostates (group 1), PE-PTEN+/- prostates (group 2), and wild-type littermate controls (group 3) (n = 6 per group, extracted from 12-month-old tissues). (B) Immunoblot for Nkx3-1 and SFRP-1 (right panel). (C) Data mining of normal prostate versus human prostate cancer. The data set of Vanaja et al. was queried by use of Oncomine, and the expression data were transformed to the linear expression signal plotted in the bar graph. Error bars, SEM. *P < .05; **P < .01; ***P < .001.

