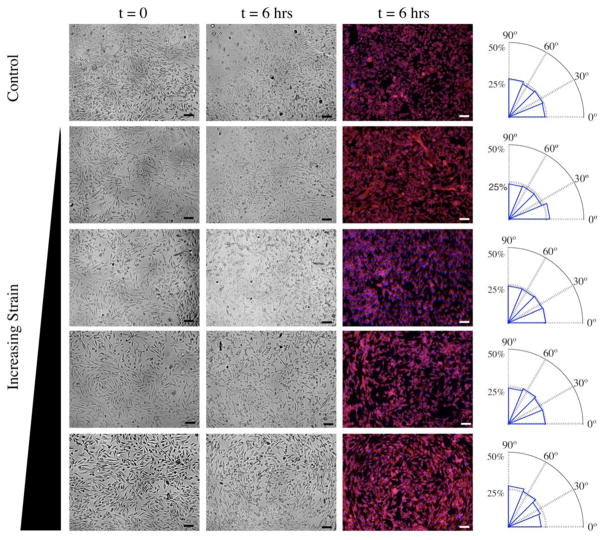
Figure 10.
Bright field and fluorescence images at t = 0 and t = 6 hrs after application of cyclic strain at a magnitude of 10 kPa pressure difference across the membrane magnitude and 1 Hz frequency. Scale bar = 100 μm. Nuclei and F-actin within the cells were stained with DAPI (blue) and rhodamine-phalloidin (red), respectively, and nucleus alignment was characterized by custom MATLAB code. Mean angular distribution of nucleus orientation (absolute angle between long axis of nucleus and radial vector to center of well) is depicted in the adjacent radial histogram (n = 5).

