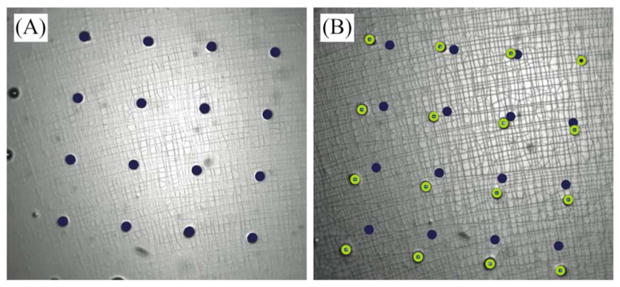
Figure 6.

Representative image pair of calibration membrane on a 1 mm radius post at (A) 0 kPa and (B) 10 kPa applied pressure difference across the membrane. The coordinates of a 4×4 grid were selected manually using a custom MATLAB script that identified pixel coordinates from the first frame (marked with dark solid circles) to subsequent frames (marked with light open circles) and used to calculate strain.
