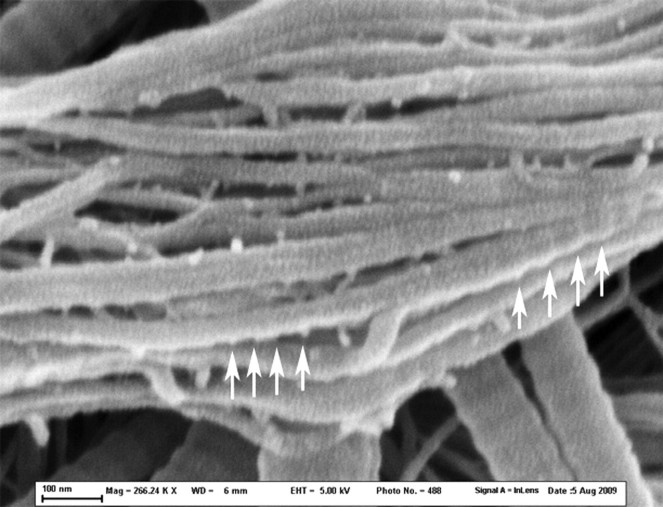
Fig. 6.
Rat tail tendons treated with cathepsin G for 5 days (266 240× magnification). This is a higher magnification of the central region in Fig. 5, with arrows indicating the greater prominence of the banding pattern is visible on subfibrils originating from the fibril surface. This suggests that the banding seen on SEM is due to materials accreted to the bands at the surface but not the depths of the fibril.

