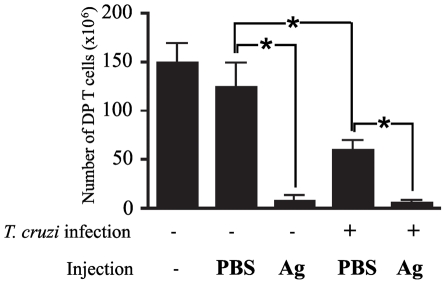
Figure 4. CD4+CD8+ T cell numbers in thymus of T. cruzi infected OVA TCR transgenic mice.
OVA-TCR transgenic mice noninfected or infected with T. cruzi (9 days post-infection) were injected i.v. with 0.5 ml of 450 mM solution of OVAp323–339 daily for 3 days and thymocytes were isolated on the fourth day for quantification of double-positive CD4+CD8+ T cells by flow cytometry. For control, mice were injected with 0.5 ml of PBS instead of the cognate antigen as indicated in the histogram. All numbers are given in 106. Each value represents the mean of total DP cell numbers in 4-8 mice per group. Data are expressed as mean ± standard error of triplicate measurements of one out of two representative experiments. *Differences between groups are significant (P<0.05). These data are representative of two independent experiments using five mice per group.

