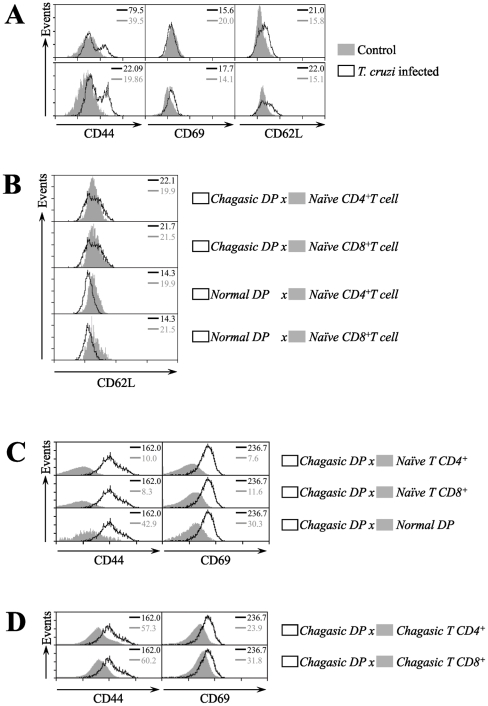
Figure 5. Activation markers in lymphocytes from thymus and subcutaneous lymph nodes of T. cruzi infected mice.
Mice were infected with T. cruzi and 15 days later lymphocytes were isolated from thymus and subcutaneous lymph nodes. (a) Thymocytes were stained with CD4-PE, CD8-APC and marker-specific fluorescein isothiocyanate-labeled antibodies prior to flow cytometry analysis. The histograms represent the expression of the CD44, CD69 and CD62L markers in total thymocytes (upper panel) and CD4+CD8+ T cells (lower panel) from chagasic and normal mice. (b) Comparison of the CD62L expression level from normal or chagasic CD4+CD8+ T cells versus normal single-positive CD4+ and CD8+ T cells undergoing intrathymic maturation. Panel (c) depicts representative histograms of CD4+CD8+ from T. cruzi infected subcutaneous lymph nodes (solid lines), compared with naïve CD4+ and CD8+ T cells obtained from non-infected mice. (d) Representative histograms of CD44 and CD69 expression in CD4+CD8+ T cells, activated single-positive CD4+ and CD8+ T cells from subcutaneous lymph nodes obtained from T. cruzi infected mice. Animals were sacrificed on day 15 post-infection. The data are representative of three independent experiments. The values on the upper right corner indicate the mean fluorescent intensity of the expression of the markers from each histogram. Differences between chagasic DP and activated T cells versus naïve T cells are significant (P<0.05). These data are representative of three independent experiments using five mice per group.

