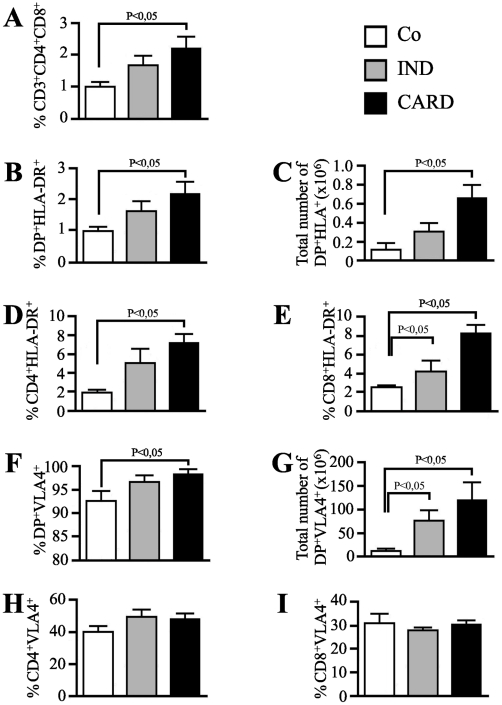
Figure 7. Frequency and phenotype of peripheral blood CD4+CD8+ T cell subset from chronic chagasic patients.
Peripheral whole blood from non-infected individuals (NI), patients at the indeterminate (IND) and cardiac (CARD) forms of Chagas disease were analyzed by four-color flow cytometry for expression of CD3, CD4, CD8, HLA-DR and VLA-4 markers (n = 15 individuals per group). (a) The percentages of CD4+CD8+ cells on CD3+ T lymphocytes are indicated for each histogram. The frequency (b) and total number (c) of activated DP T cells, frequencies of (d) single-positive CD4 T cells and (e) CD8 T cells are shown by assessing the expression of HLA-DR. The frequency (f) and total number (g) of activated DP T cells, frequencies of (h) single-positive CD4 T cells and (i) CD8 T cells are shown by assessing the expression of VLA-4. The differences between the groups were considered significant at p less than 0.05 and are represented by p<0.05.

