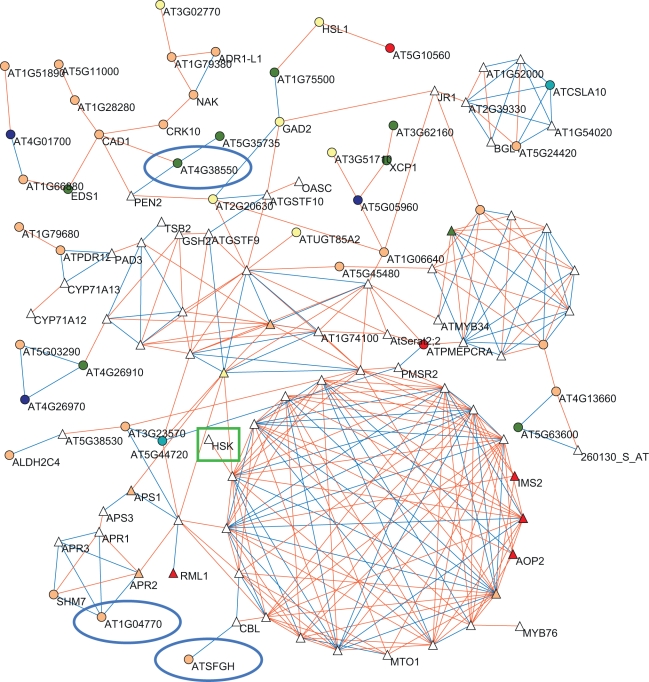
Figure 6. Largest co-expression network of GWA candidates and known GSL core genes.
The largest co-expression network involving all genes showing a significant association with a glucosinolate phenotype and the core network of known or predicted glucosinolate genes (Table S7) is shown. Labels for genes with more than five neighbors are not shown due to the density of network. The GSL core is represented elsewhere in a magnified view to provide legibility (Figure S3). Triangles show genes known or predicted to be involved in glucosinolate biology, while circles represent significant GWA candidates not previously linked with glucosinolate production. White symbols show genes with no significant GWA hit in these studies. Other colors show a GWA candidate in the listed dataset: apricot for control; teal for silver; yellow for seedling; olivegreen for control and silver; blue for control and seed; cyan for control and seed; red is for all three datasets. Highlighted are genes mentioned in the text: a green rhombus indicates previously known/predicted GSL-related genes, while blue circles indicate GWA candidate genes that were selected for validation in the current study (Table S9).

