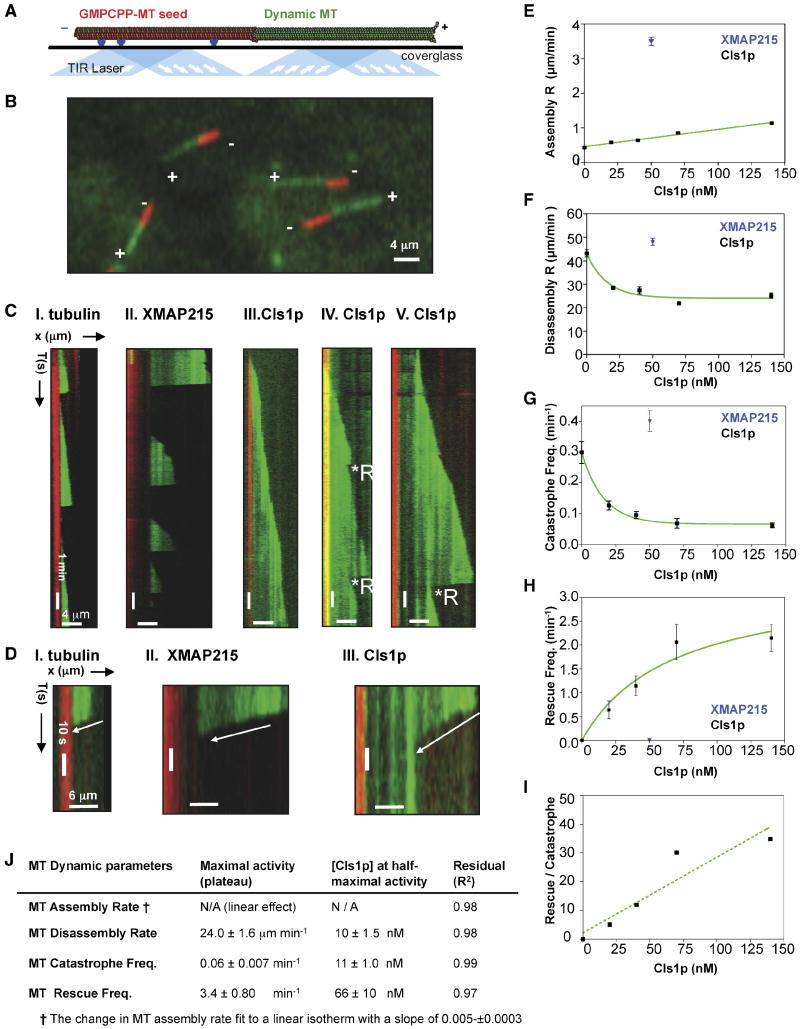
Figure 3. Effect of CLASP on MT dynamics parameters.
A) Scheme for total internal refection fluorescence (TIRF) microscopy used to study MT dynamics. Surface-attached anti-biotin antibodies (blue) bind biotin-labeled GMPCPP-stabilized MT seeds (red). The seeds near the surface nucleate AlexaFluor-488-labeled (green) dynamic MTs from 6 μM soluble tubulin dimers in the presence of GTP. TIRF illumination by 564 nm and 488 nm lasers. Image adapted from Brouhard et al (2008).
B) TIRF image of assembling MTs. Seeds (red) initiate assembly of dynamic MTs (green) at plus ends (+) only.
- I. 6 μM tubulin: dynamic MTs show slow assembly, rapid disassembly, and frequent catastrophes.
- II. 50 nM XMAP215 + 6 μM tubulin: dynamic MTs show rapid MT assembly and frequent catastrophes.
- III-V. 40 nM Cls1p + 6 μM tubulin: Panel III shows a relatively slow assembly MT rate and no catastrophes. Panel IV shows a dynamic MT assembling slowly with two catastrophes, each followed by a rescue. Panel V shows a dynamic MT assembling slowly and a catastrophe that leads to extended disassembly, which is followed by a rescue.
D) Close-up kymographs in C show MT disassembly at higher time resolution.
E) Effect of Cls1p concentration on MT assembly rate. Cls1p (black) accelerates MT assembly slightly, while 50 nM XMAP215 (blue) increases the assembly rate by ten-fold (Supplementary Table S2; Brouhard et al, 2008). Each point (Supplementary Table S2) represents the mean of Gaussian distribution fit of a large number of assembly events measured for each Cls1p concentration (distributions are shown in Fig S4A).
F) Effect of Cls1p concentration on MT disassembly rates. Each point (Supplementary Table I) represents the mean of Gaussian distribution fits for a large number of events at different Cls1p concentrations (distributions are shown in Fig S4B).
G) Effect of Cls1p concentration on MT catastrophe frequency (Supplementary Table S2). Each point (Supplementary Table S2) represents the mean from a Gaussian distribution to a large number of catastrophe frequencies measured for each Cls1p concentration (distributions are shown in Fig S4C).
H) Effect of Cls1p concentration on the MT rescue frequency. Each point (Supplementary Table S2) is the mean rescue frequency measured for each Cls1p concentration shown in Fig S4D.
I) Effect of Cls1p concentrations on the ratio of MT rescue to MT catastrophe. At 140 nM Cls1p, on average every MT catastrophe (one event per 15.6 minutes of MT assembly) was reversed by a rescue (one event per 45 seconds of MT disassembly).
J) Table fitted Cls1p concentration and maximal effects summarizing data from panels E-I.

