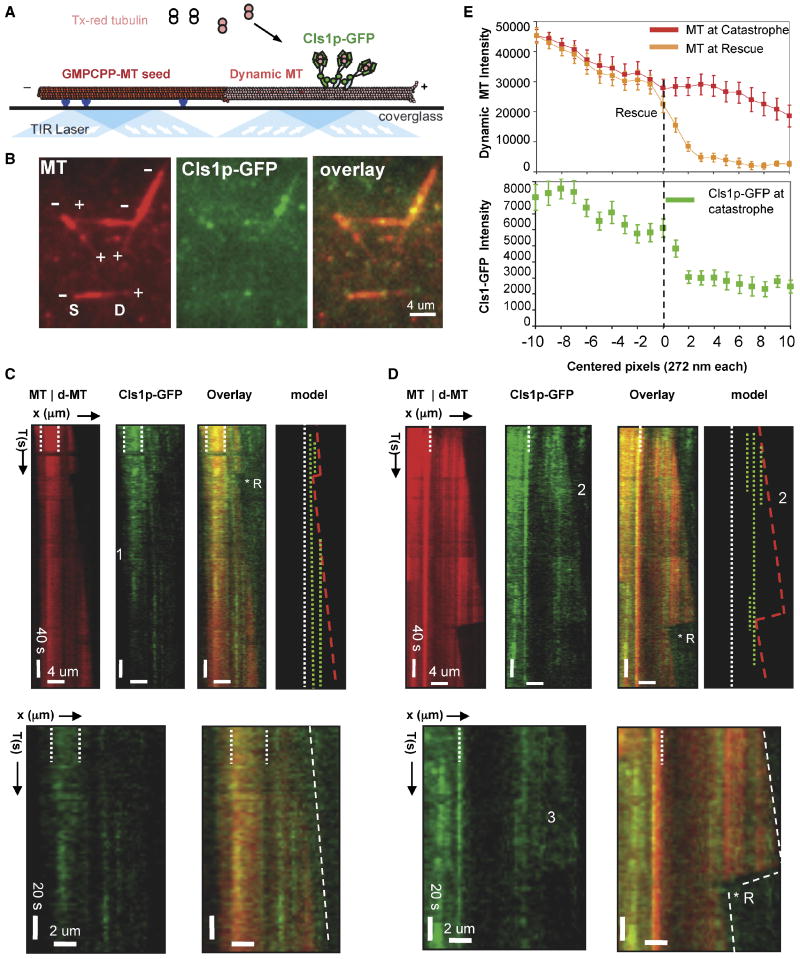
Figure 5. Sites of high CLASP concentration locally anticipate sites of MT rescues.
A) Schematic of TIRF microscopy assay used for imaging MT dynamics and for simultaneous imaging of dynamic MTs and Cls1p-GFP localization. Anti-biotin antibodies (blue) capture biotin- and Texas-red labeled GMPCPP polymerized MT seeds (red) near the silanized glass surface. Densely labeled Texas-red MT seeds nucleate dynamic MT assembly from 6 μM tubulin dimers, less densely labeled with Texas–red, in the presence of GTP and Cls1p-GFP (see methods). Image adapted from Brouhard et al (2008).
B) Raw TIRF image of dynamic MTs and Cls1p-GFP. Left panel: dynamic MTs growing at plus ends of MT seeds. Note, high fluorescence intensity of the MT seed compared to the dynamic MT. Middle panel: Cls1p-GFP non-uniformly bound along dynamic MTs (middle panel). Cls1p-GFP accumulates more densely along the seed. Right Panel: overlay of both images.
C) Cls1p-GFP binding along assembling dynamic MTs. Left panel: kymograph of dynamic MT (dMT) growing from a more densely labeled GMPCPP-MT seed (delimited by white broken lines). A single catastrophe occurred and was reversed by a rescue (*R). MT assembly then continued without further catastrophes. Second from left: Cls1p-GFP molecules bind more densely along the GMPCPP MT seed than along growing MT. Photobleaching decreased Cls1p-GFP fluorescence at the position marked by the numeral 1. Sites occupied at high Cls1p-GFP concentration remain at fixed positions without diffusion. Third from left: sites of Cls1p-GFP binding along a growing MT. Right: model kymograph showing the positions of high local concentration of Cls1p-GFP (broken green lines) along dynamic MTs (boundaries in red lines). Higher magnification kymographs show Cls1p-GFP molecules bound along an assembling MT. Note the absence of MT plus-end tracking. An additional example is shown in Fig S6A, IV.
D) Sites of high concentration of Cls1p-GFP molecules correlate with sites of MT rescue on a dynamic MT. Left panel: kymograph of dynamic MT (dMT) assembling from an intensely labeled GMPCPP-MT seed (MT, white broken lines). A catastrophe was followed by MT disassembly and a rescue (R*). Second panel from left: Cls1p-GFP (green) binds non-uniformly and without diffusion along the dynamic MT. Note that three Cls1p-GFP bands form, but two dissociate early during assembly (marked by the numeral 2). Third panel from left: sites of MT rescue correlate with positions of high Cls1p-GFP density (green) on a dynamic MT (red). Right: model kymograph showing the position of Cls1p-GFP dense bands (broken green) compared to the dynamic MT boundary (red) growing from the GMPCPP MT seed (broken white line). Higher magnification images show correlation of Cls1p “bands” with MT rescue. Additional examples are shown in Fig S6A, I-III. Note the loss in the diffuse Cls1p-GFP fluorescence (marked by #3) reproduces the MT disassembly rate. Fig S5C shows MT rescues were not observed in the absence of sites of high Cls1p-GFP concentration along dynamic MTs
E) Correlation of local Cls1p-GFP concentration on the MT with MT rescue. Average fluorescence intensity profile (see Methods) of a dynamic MT before catastrophe (red profile), dynamic MT at rescue (orange profile), and Cls1p-GFP along dynamic MT before catastrophe (green profile) for 20 different rescue events (more details in Fig S6B). Note that the Cls1p-GFP intensity peaks within 1 pixel (272 nm) of the site of rescue and the increase is three folds higher at that site than any pixel prior. The raw intensity profiles for Cls1p-GFP with MT rescue and statistical significance of Cls1-GFP intensity increase are shown in Fig. S6B.

