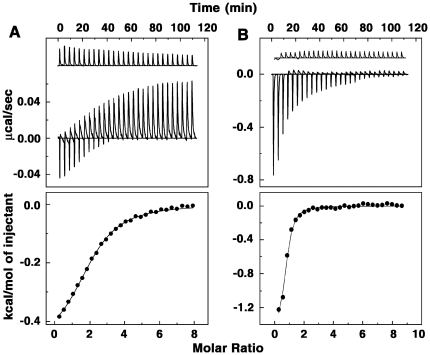
Figure 7. ITC profiles for the binding of (A) ADG and (B) DAU with tRNA.
The top panels represent the raw data for sequential injection of tRNA into drug solution and the bottom panels show the integrated heat data after correction of heat of dilution against molar ratio of poly(A)/drug. The data points (closed circle) were fitted to a one site model, and the solid lines represent the best fit data.

