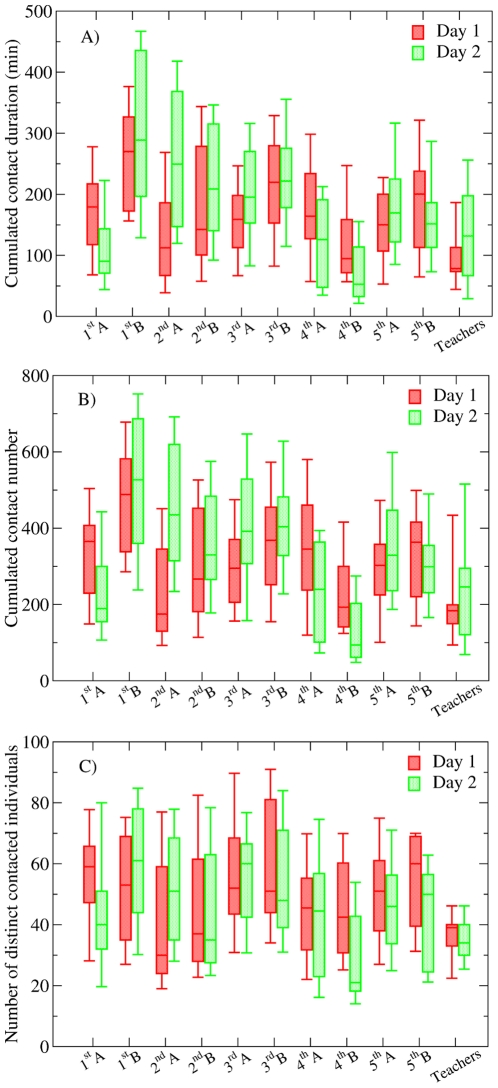
Figure 2. Boxplots of the distributions of the cumulated duration (A, in minutes) and number (B) of contacts involving an individual, for each class and for each day.
Panel C gives the distributions of the number of distinct individuals with whom an individual of each class has had at least one contact. In each boxplot, the horizontal line gives the median, the box extremities are the 25th and 75th percentiles, and the whiskers correspond to the 5th and 95th percentiles.

