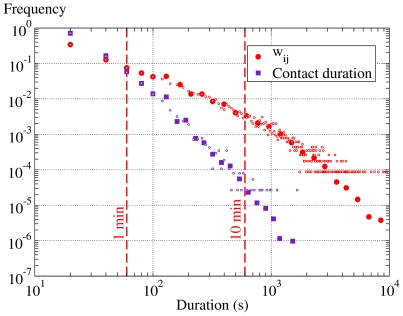
Figure 3. Log-log plot of the distribution of the contact durations and of the cumulated duration of all the contacts two individuals i and j have over a day (.
 ). 88% of the contacts last less than 1 minute, but more than 0.2% last more than 5 minutes. For the cumulated durations, 64% of the total duration of contacts between two individuals during one day last less than 2 minutes, but 9% last more than 10 minutes and 0.38% more than 1 hour. The small symbols correspond to the original distributions, and the large symbols to the log-binned distributions.

