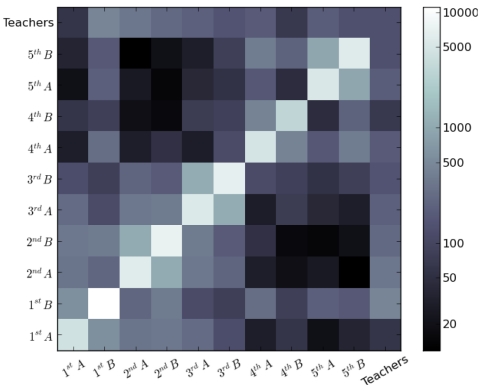
Figure 5. Grayscale-coded contact matrix between classes.
The matrix entry for row A and column B gives the cumulated duration ( , in minutes) of contacts measured between individuals of classes A and B over the two days of data gathering. A logarithmic grayscale is used to compress the dynamic range of the matrix entries and enhance the off-diagonal hierarchical structure.

