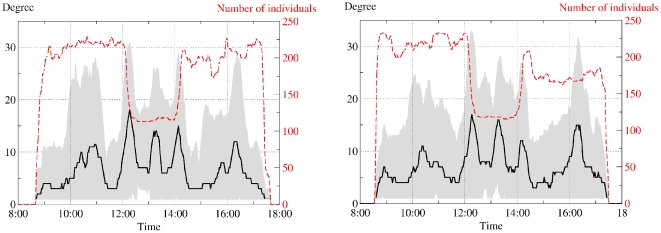
Figure 6. Degree of individuals in the contact networks aggregated over sliding time windows of 20 minutes during the first day (left) and the second day (right) of data collection.
The median value is represented with a black line, the 95% confidence interval is shown in gray and the number of individuals over which the statistics are calculated is shown in red dashes. Breaks and beginning and end of lunch are characterized by a sudden increase of the degree, showing the occurrence of large numbers of contact events.

