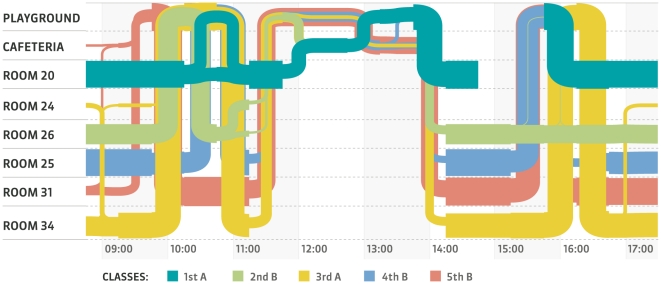
Figure 10. Approximate spatiotemporal trajectories of some classes.
Each row corresponds to a particular place in the school (classroom, canteen, courtyard) where a RFID reader was situated, and each colored line corresponds to the spatio-temporal trajectory of the children of a class (only 5 classes are shown for clarity). Line widths correspond to the number of children whose approximate position correspond to the row area. A line can become thinner if children leave the school (for instance during the lunch break, to have lunch at home) or divide itself into two thinner lines if two groups of children of the same class follow distinct paths in the school The trajectories highlight how mixing between classes, shown by the fact that the colored lines overlap, occurs during the breaks and is strongly constrained by the school schedule.

