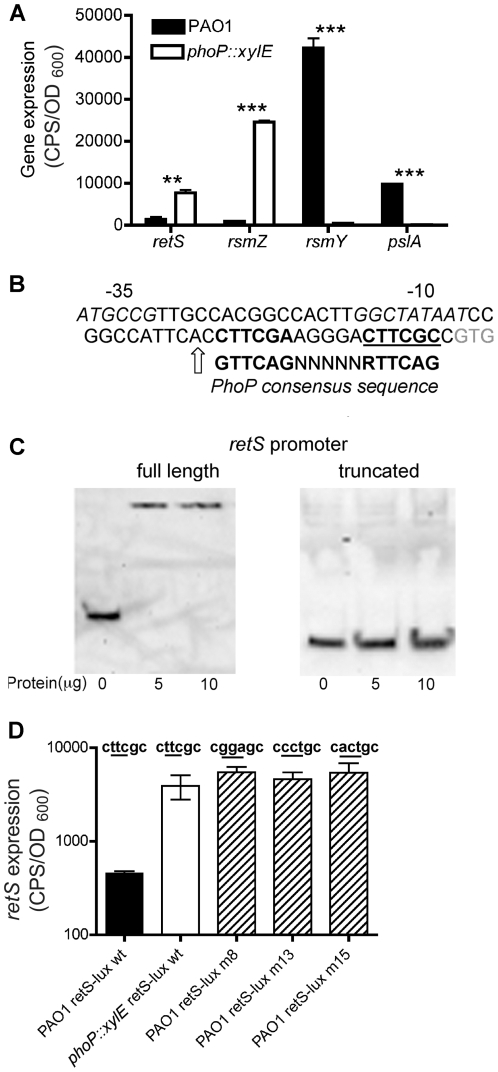
Figure 7. Crosstalk between the Mg2+ sensing PhoPQ TCS and the RetS biofilm regulatory pathway.
(A) PAO1 and phoP::xylE were cultured in BM2 0.02 mM Mg2+. Expression of retS, rsmZ, rsmY and psl was analysed using plasmid encoded promoter-lux fusions. Gene expression data during log phase are shown. Values are representative of at least 3 independent experiments and error bars represent the standard error of the mean (SEM). (B) Identification of putative PhoP box (repeats indicated in bold) in the retS promoter with the predicted (BPROM) −10 and −35 sites (italicized). A full length (366 bp) and truncated (239 bp) retS promoter, with and without the predicted PhoP box (bold) (genome coordinates 5451891–5452257 and 5451891–5452131, respectively) were PCR amplified and labeled with DIG. Arrow indicates last nucleotide of reverse primer for truncated promoter, upstream of the GTG start codon (grey). (C) Gel shift assays of DIG-labeled full length and truncated retS promoter fragments with purified His6-PhoP protein. (D) RetS promoter activity (lux) in BM2 0.02 mM Mg2+ cultures of PAO1 and phoP::xylE using wildtype retS promoter sequences and in PAO1 following mutation (underlined) of the second repeat in the PhoP box in the retS promoter. Data shown are representative of 3 independent experiments and error bars represent the standard error of the mean (SEM). **, significant difference (p<0.01, ANOVA); ***, significant difference (p<0.001, ANOVA) in PAO1 compared to that of phoP::xylE.

