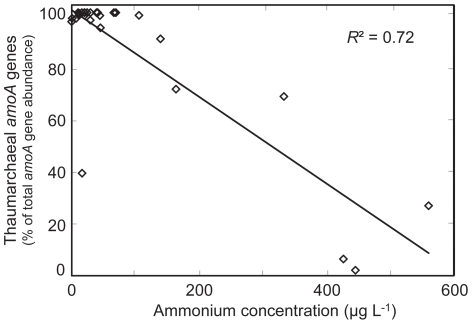
Figure 2. Freshwater aquaria ammonium concentrations and relative thaumarchaeal amoA gene abundances.
AOA amoA gene copies are expressed as a percentage of the total amoA gene copies (per ng DNA). The coefficient of determination (R2) for the linear regression is 0.7249. The associated Pearson correlation coefficient (r) is −0.8518, with an associated p-value of <0.001. See Table S1 for all sample data.

