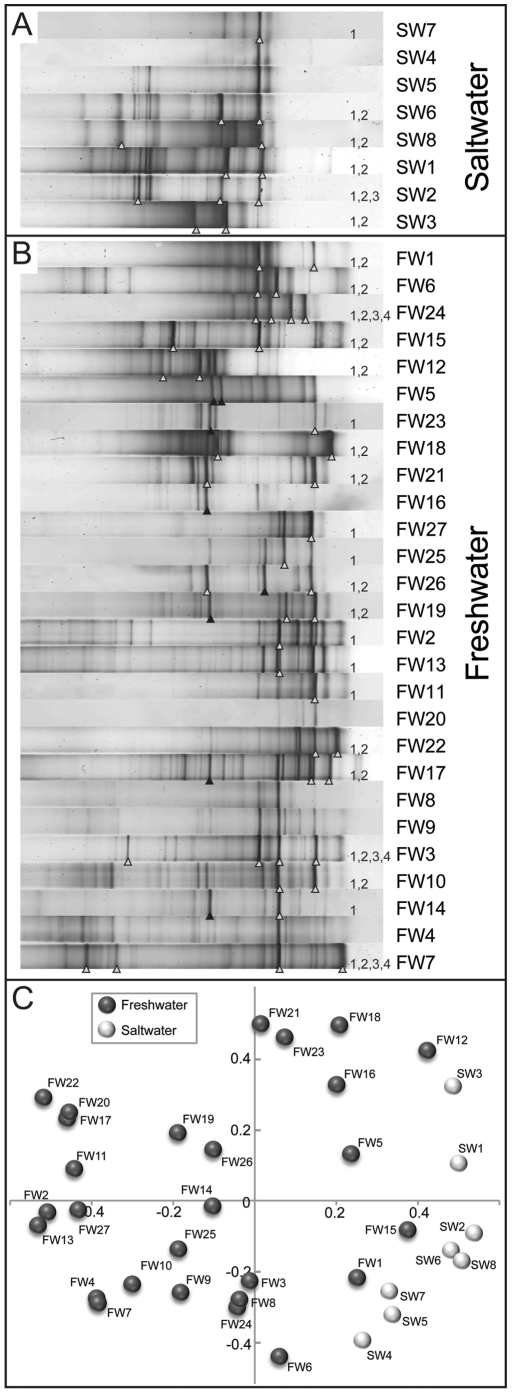
Figure 3. Denaturing gradient gel electrophoresis of thaumarchaeal amoA gene amplicons.
Saltwater (A) and freshwater (B) fingerprints have been normalized and aligned. Bands chosen for sequencing are indicated with triangles: white triangles correspond to bands appearing in Figure 4. Black triangles represent failed sequencing reactions. Clustering of freshwater and saltwater fingerprints (C) is based on nonmetric multidimensional scaling (NMDS) using Pearson correlations of background-subtracted densitometric curves.

