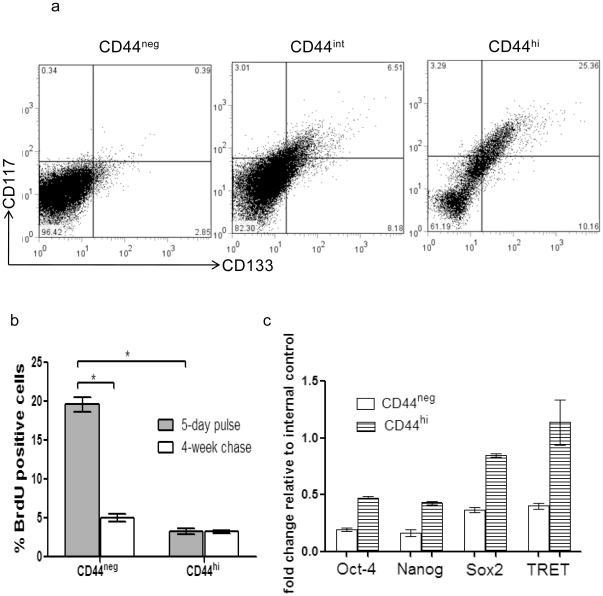
Figure 2. Phenotypic analysis of tumor cells.
(a) CD117 and CD133 staining of tumor cells. Mice salivary gland tumor cells were divided into CD44neg, CD44int, and CD44hi subpopulations via FACS; each subpopulation was analyzed for CD117 and CD133 expression. (b) BrdU incorporation. BrdU was injected into tumor-bearing mice at 50 mg/kg twice daily for 5 days, then half of the mice were sacrificed and half were rested for 4 weeks before CD44 and BrdU analysis. (n = 5 each group, * p<0.05 t-test). (c) Comparison of transcript levels for stem cell related genes in CD44neg and CD44hi tumor cells. Transcripts levels for all four genes were higher in CD44hi cells than in CD44neg cells (p<0.05, t-test).

