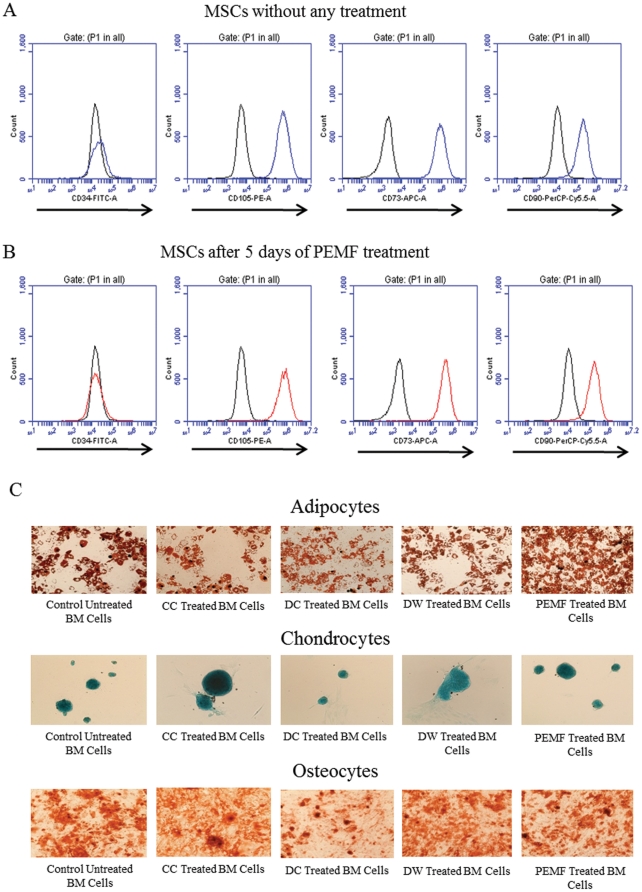
Figure 1. FACS analysis of Mesenchymal Stem cells (MSCs) with and without electrical stimulation.
A, MSCs from bone marrow were harvested and at passage 3 were analysed for CD34, CD73, CD90 and CD105 expression. Mouse anti-human primary antibodies conjugated with fluorophores were used to label the cells. More than 90% of the MSCs were positive for CD73, CD90 and CD105 and were negative for CD34. B, PEMF treated MSCs showed the same morphology as untreated MSCs and therefore there is no effect of electrical stimulation on MSC marker expression. Similar results were obtained for DC, DW and CC treated cells (not shown here). Black line = Isotype control; Coloured lines = Labelled cells. C, MSCs tri-lineage assay confirming the differential potential of cells obtained from bone marrow. Cells differentiated into all three lineages of osteocytes, chondrocytes and adipocytes with or without electrical stimulation. Total magnification for each figure = 100x.

