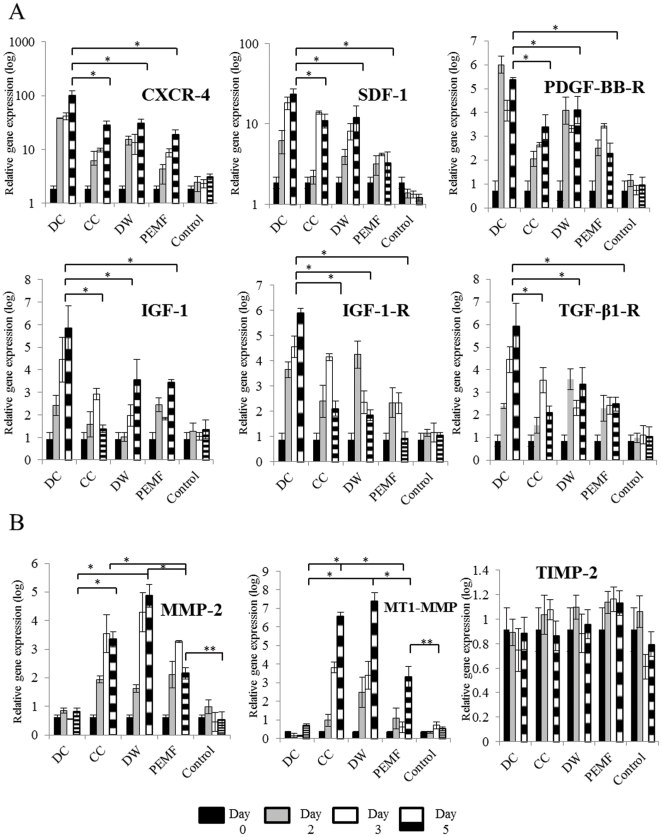
Figure 6. Effect of electrical stimulation (ES) on gene expression.
A, Quantitative-RT-PCR analysis of migration genes after 2, 3 and 5 days of stimulation. ES increased the expression of the migratory genes with DC treated Bone marrow stem cells (BMMSCs) showing a significant increase in expression of SDF-1, CXCXR4, PDGF-BB-R, TGF-β-1-R, IGF-1 and IGF-1-R compared to other waveforms (p<0.001) on day 5. B, Quantitative-PCR analysis of invasion genes after 2, 3 and 5 days of ES. CC, DW and PEMF increased the expression of MMP-2 and MT1-MMP (p<0.001) compared to unstimulated BMMSCs and PEMF cells after 5 days of stimulation. DC treated cells showed similar expression of MMP-2 and MT1-MMP compared to unstimulated BMMSCs. TIMP-2 expression remained constant for unstimulated and treated BMMSCs. **; p<0 .05, *; p<0.001. SDF-1; Stromal Derived Growth Factor-1, PDGF -BB-R; Platelet derived growth factor beta receptor, TGF-β1-Transforming growth factor-1 receptor, IGF-1;Insulin growth factor-1, IGF-1-R;Insulin growth factor-1 receptor, MMP-2; Matrix Metalloproteinase 2, MT1-MMP;Membrane Type 1- Matrix Metalloproteinase, TIMP-2;Tissue inhibitor of matrix metalloproteinase-2.

