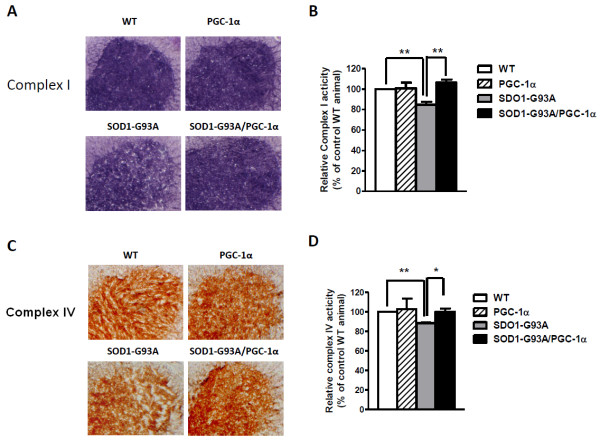
Figure 4.
Detection and quantification of mitochondrial electron transport chain complex activities in the ventral horn of lumbar spinal cord. (A) Representative images of complex I activity in the four experimental groups; (B) Quantification of complex I activity (*p < 0.05); (C) Representative images of complex IV activity in the four experimental groups; (D) Quantification of complex IV activity (*p < 0.05).

