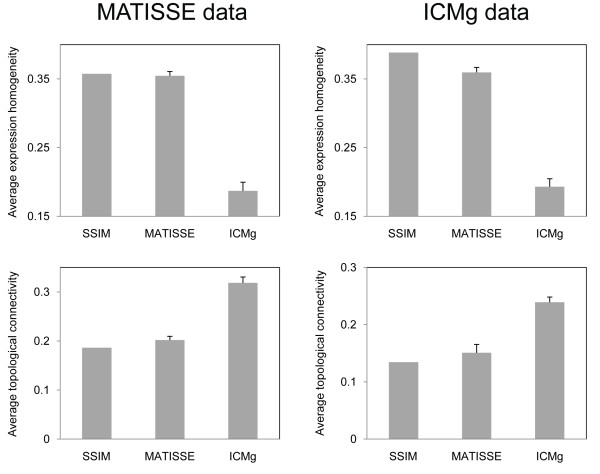
Figure 2.
Expression homogeneity and topological connectivity of modules. Expression homogeneity and topological connectivity of a module were calculated using average Pearson correlation among genes in the module and average clustering coefficient of the network generated by the genes, respectively. Average expression homogeneity and connectivity over all modules were shown for each method. For MATISSE and ICMg, mean and standard deviation over 20 runs were taken.

