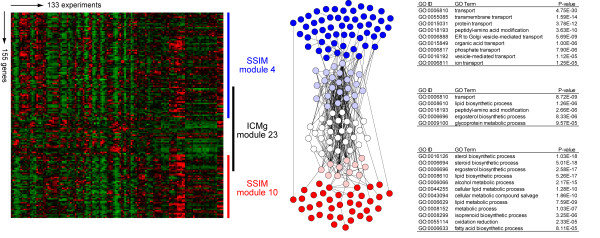
Figure 3.
Comparison between modules identified by ICMg and SSIM. One of the modules identified by ICMg method (ICMg module) shares a number of genes with two separate modules identified by SSIM (SSIM module A and B). Expression profiles of genes in three modules were shown on the left and protein-protein interaction network was shown in the middle. Genes shared by ICMg and SSIM modules are indicated by pink and light blue nodes, and ones exclusively belong to ICMg, SSIM module A and SSIM module B are depicted by white, red and blue nodes, respectively. In the right panel, enriched GO BP terms (p < 1 × 10⁻⁵) and their uncorrected p-values for each module are summarized.

