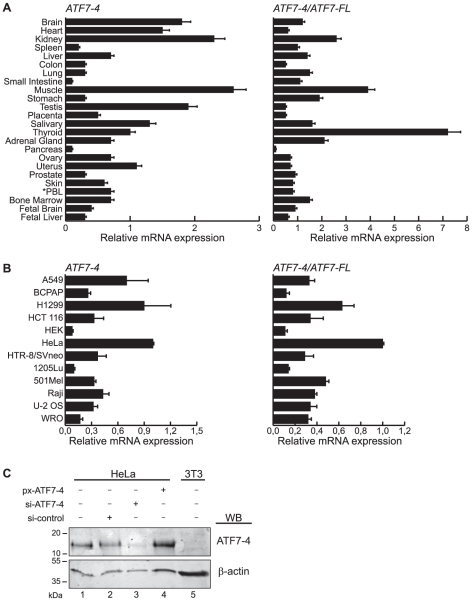
Figure 2. Pattern of expression of ATF7-4 transcript.
(A and B) Real-time RT-PCR analysis of ATF7-4 gene expression profile (left panels) (A) in a 24 human tissue-cDNA array and (B) in a selection of human transformed cell lines. Right panels show the ATF7-4 expression relative to that of ATF7-FL. PBL stands for peripheral blood leucocytes. Data are the average of at least five independent experiments (standard deviations are shown). Data were normalized to β-actin gene expression. (C) Endogenous ATF7-4 protein was analyzed by western-blotting (WB) with a specific anti-ATF7-4 monoclonal antibody in human HeLa cells and mouse 3T3 fibroblasts. HeLa cells were transfected with either the px-ATF7-4 expression vector or a control, or specific siRNA targeting ATF7-4. β-actin was analyzed in parallel as a loading control.

