Figure 1.
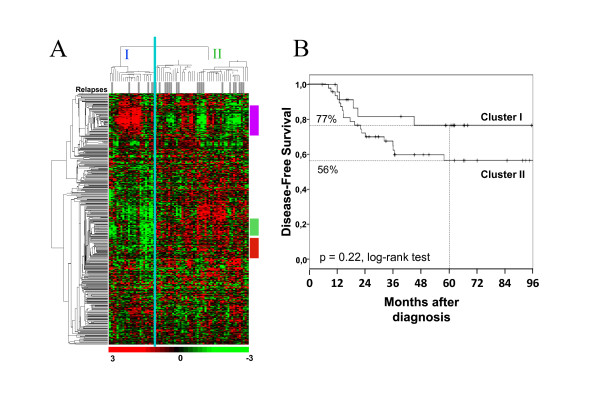
Hierarchical clustering of basal breast cancer. (A) Unsupervised hierarchical clustering of 73 non-metastatic non-inflammatory basal BCs from IPC with 360 genes coding for kinase or kinase-interacting proteins overexpressed in basal tumors. Each row represents a gene and each column a sample. The expression level of each gene in each sample is relative to its median abundance across the samples and is depicted according to the color scale shown under the matrix. Red and green indicate expression levels respectively above and below the median. Relapses are indicated in the stripe under the dendrogram: white for no relapse during follow-up, and grey for relapse. Two tumor clusters (I and II) are delineated by the vertical green line. To the right, vertical colored bars indicate the three clusters identified by the QT clustering method: purple, immune-related cluster; green, biologically unspecific cluster; red, proliferation-related cluster. (B) Kaplan-Meier disease-free survival curves for cluster I patients (n = 24), and cluster II patients (n = 49).

