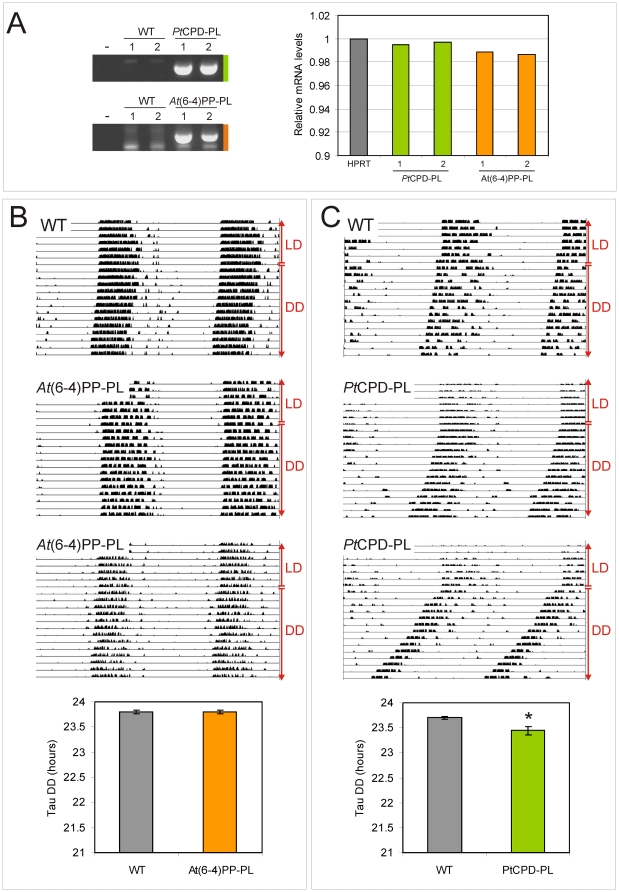
Figure 2. Circadian behavior of photolyase transgenic mice.
(A) Quantitative RT-PCR analysis of photolyase mRNA levels in the laser-microdissected SCN of PtCPD-PL and At(6-4)PP-PL transgenic mice. Left panel: Ethidium bromide stained gel of PCR amplified cDNA, obtained from two independent transgenic mice and corresponding wild type littermates (sacrificed at ZT3). Right panel: graphic representation of quantitative RT-PCR amplification data from two independent animals per genotype (see Experimental procedures for details). The Y-axis represents the PtCPD-PL and At(6-4)PP-PL mRNA levels relative to that of Hprt. (B, C) Circadian behavior of At(6-4)PP-PL (B) and PtCPD-PL (C) transgenic mice and corresponding littermates (n = 10 per genotype). Animals were kept under normal light conditions (LD 12∶12 h) and subsequently exposed to constant darkness (DD) (indicated on the right side of the panels). Shown are representative examples of double-plotted actograms and graphic representations of the free-running period (τ) in constant darkness (bottom panels). Error bars represent the standard error of the mean (SEM); the asterisk indicates significance (p = 0.03).

