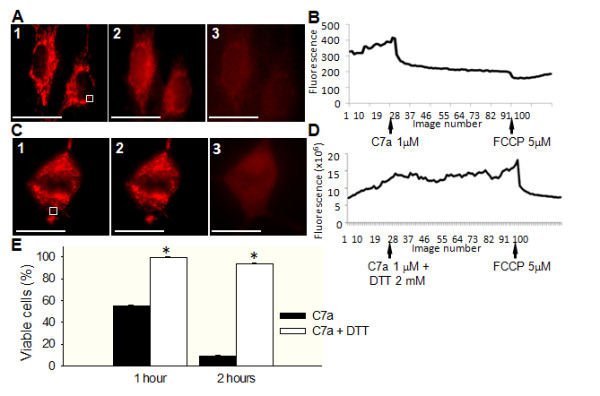
Figure 3.

Effect of C7a on mitochondrial membrane potential in intact cells, and inhibitory effect of DTT on C7a. (A1 and C1) Representative image of ΔΨm in B16F10-Nex2 cells in resting conditions after incubation with TMRE. White squares represent one ROI, as described in Material and Methods; (A2) Representative image of TMRE-incubated cells immediately after C7a addition; (A3) Representative image of TMRE/C7a-treated cells immediately after FCCP addition. Scale bars, 20 μm. Images show one of 30 similar images that were acquired at 1 frame/6 seconds, 400 × magnification. (B and D) Representative traces of TMRE fluorescence over time in B16F10-Nex2 cells, arrows show the moment C7a or FCCP were added to the cells. (C2) Representative image of TMRE-incubated tumor cells, pretreated with DTT and immediately after C7a addition. (C3) Representative image of TMRE/C7a/DTT-treated tumor cells immediately after FCCP addition. Scale bars, 20 μm. Images were acquired as described in (A). (E) Cytotoxic effect of C7a in the presence or absence of DTT. The percentage of viable cells related to untreated control is represented. *p < 0.05, compared to untreated cells at the same time. Each experiment was performed at least 3 times.
