
Figure 6.
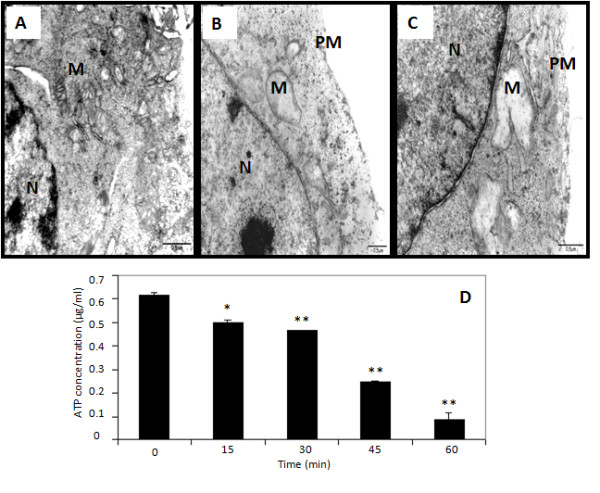
Transmission electron microscopy and intracellular ATP concentration after C7a treatment. (A) Untreated control cells; (B and C) C7a treated cells. N, nucleus; M, mitochondria; PM, plasma membrane. Scale bars, 0.5 μm; (D) B16F10-Nex2 cells were treated with C7a and the ATP levels were evaluated at different time points, as described in Materials and Methods. *, p < 0.05 and **, p < 0.01, compared to cells at time zero. Results are representative of 3 independent experiments.